Text: Augustina Lavickaite | ACED
The urge to understand, organize, and structurize the world around us has been part of human existence for as long as we are aware. Complex algorithms, such as programs for self-driving cars, or groups of elementary ones, such as primitive rituals of sacrifice, are examples of actions intended to understand and control the future. As our experience and knowledge of the surroundings grow, these actions become more complex. We have handed over most of the repetitive and time-consuming calculations as well as a rising amount of cognitive tasks to technology, increasing the flow of new knowledge, but creating a fracture of expertise and a decrease in understanding.
The most prominent and successful approach to dealing with the oversaturation of information has been the collaboration between design, art, journalism, and technology. Such an interdisciplinary field stimulates public debate on social issues with innovative projects by visually interpreting complexity and making it accessible and interactive to a wider audience. This crossover domain is the focus of Designalism, a platform for creatives and thinkers, who work on the spectrum of design, art, and journalism. We talk to some of the artists from the Designalism database and podcast on the roles creatives and thinkers play in a reality oversaturated by information.
This is the second of our three-part series of interviews. Italian-born graphic and information designer Irene Stracuzzi, focuses on geopolitics and cartography, making both commissioned and self-initiated projects. Her work often deals with objectivity and the interpretation of data.
How would you describe complexity?
I: I think of the complexity of the data we can access. And then the question I ask myself is what is the role of the designer in filtering this complexity and giving it shape and selecting it and making a project that is able to share some of this big data and information. Then the position of the designer is really visible and relevant because it’s this filtering act between the data and the message.
But I think also the result itself still shows the complexity of the issue. Because for example, in the way I work, I never deal with one set of information, there are several. And usually, I ask the audience to feed the pieces together to try to understand what is going on through these different datasets. So even though I made the first filtering, there is still a lot of different information that one has to process to derive meanings for themselves. But why I use this approach is that I really like that the audience can get their own conclusions out of what I show them, even if I direct them through specific interests that I have or things I want to show them. Still, you’re able to make up your own position towards what you’re seeing.
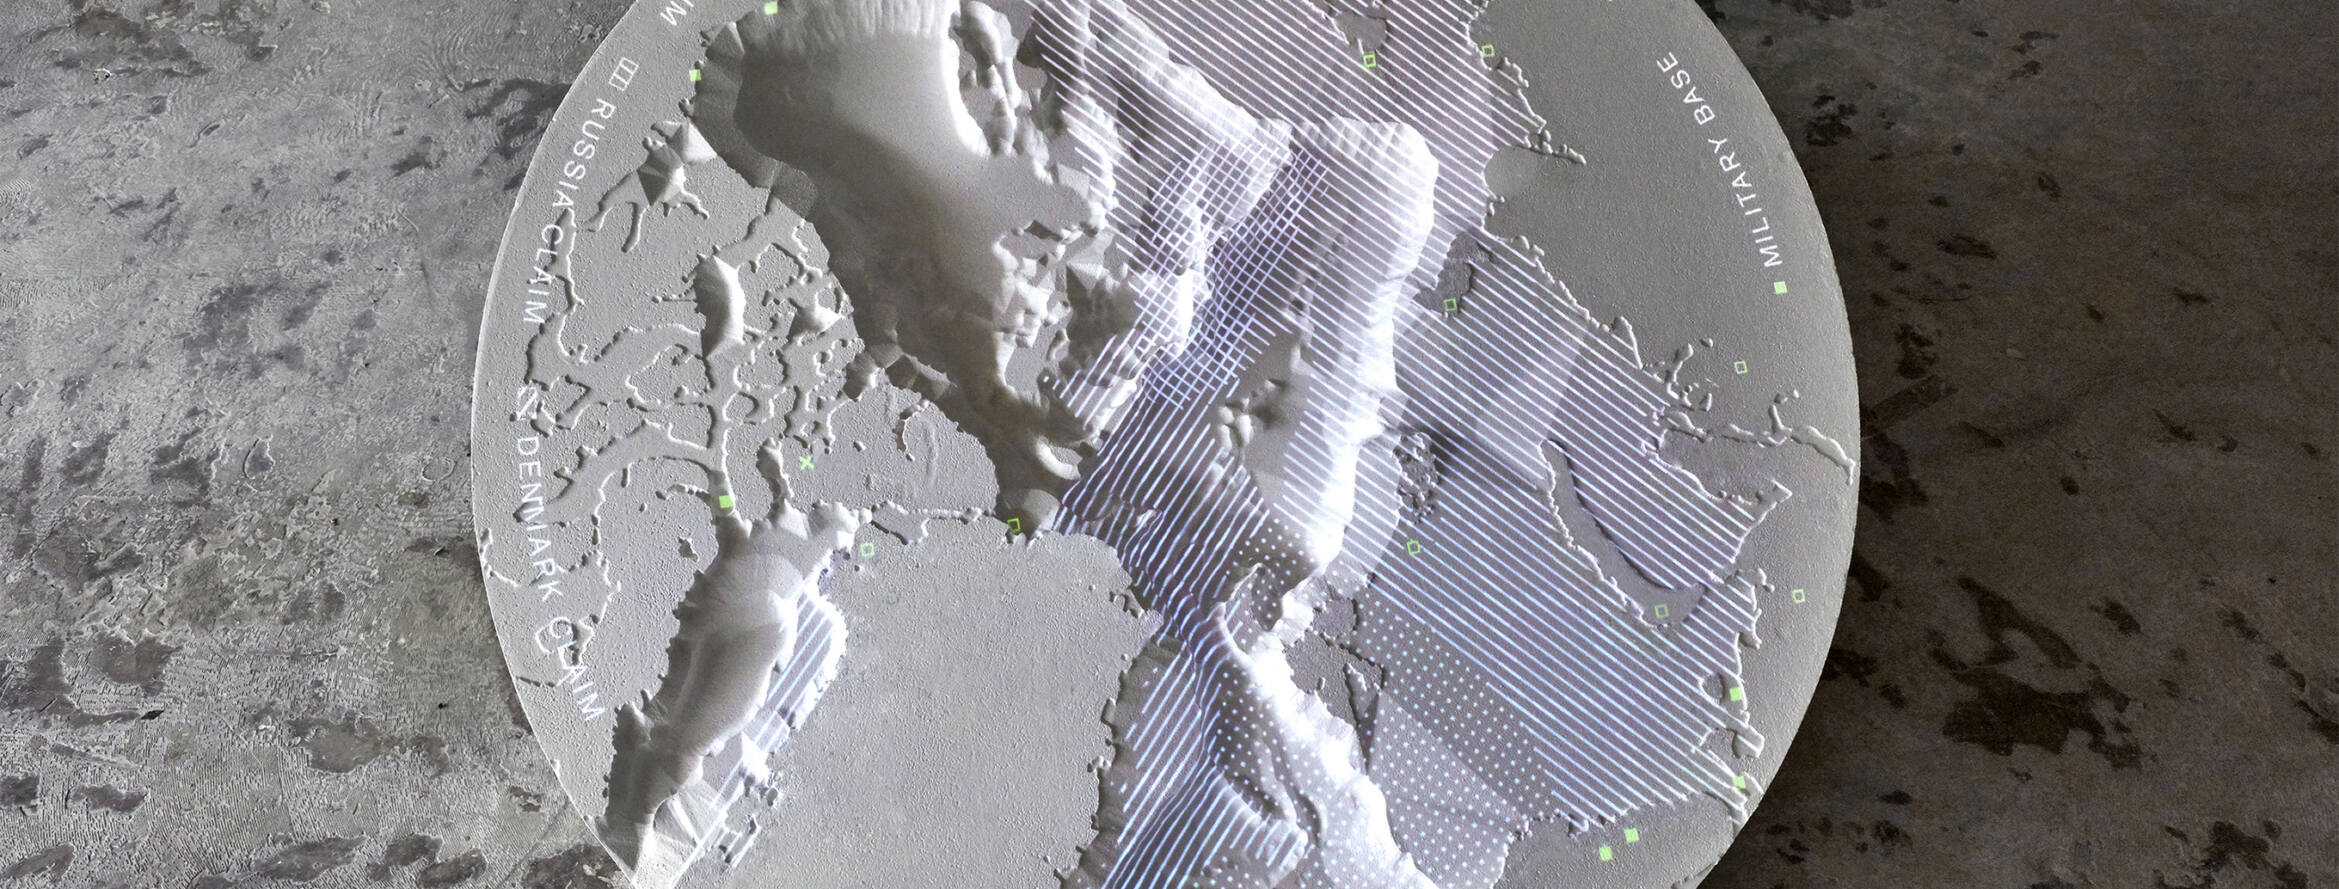
For example, in the Arctic project, I was looking more into its geopolitics. So then I didn’t have so much information because most of it is actually hidden. But on the other hand, the last project I made a few months ago also in the Arctic in the permafrost was dealing with more scientific information. And then there’s really a lot of data that is processed by scientists and this becomes overwhelming in a way. And I had to find a way to say something that was meaningful. The problem is that with scientific information, it makes sense once you have processed years and years of data. I’m not criticizing it because it’s the scientific method in that sense. But still, that’s what makes it complex and difficult to come to a conclusion about what you’re working with. There’s never an end to the amount of information you can get. I think there’s always, you can always get more. So it’s unlimited in that sense.
How do you bring issues of the oversaturation of information to the public?
I: Specifically trying not to be neutral so that the person would know that this is your interpretation of their interpretation. I think that method works because I’m from the point of view of a graphic designer or designer. I deal with visuality and that’s my main way to show this. But for sure complexity is not just in the amount, it’s also in the actual complexity, the intellectual complexity of what you’re dealing with. Making it more simple to understand is also a way to show that there’s no neutrality because I’m reworking it. The lack of neutrality is just important to highlight. I think people in my field often just show things, taking them for granted and assuming that people will also take them for granted. There’s not really much thinking behind it. So I see it as my role to try to highlight it as much as possible. I think in any case, when you make a visualization, it will always look a bit neutral or proper, cause I’m not dealing with fake information. So I’m not making up data. It’s also a question that the audience can bring home.
Why is it important to address complexity from an interdisciplinary perspective?
I: For the last project, I worked with a scientist from the University of Amsterdam and it was really, really interesting to work with him because he actually had more concerns than me about people not understanding what they were doing, because they’re used to dealing with all sorts of incomprehensible graphs and just lists of numbers and data. And I want it to fit that through the project. And he was more like “let’s just explain how it works without data.” It was quite interesting.
I think there’s definitely a benefit in collaborating with other disciplines, especially with disciplines that deal with data on a different basis. For example, in the scientific community, this kind of data is always shared between themselves. So they know what they’re talking about. And there’s never a question of what would be the most important things that our audience needs to see in order to understand what is going on. So it was really nice to have these conversations with him to try to figure out what pieces are key or essential to basically transform data into storytelling. They want to make things simple, but they’re still concerned with being very accurate in what you say and not being misunderstood, because I think that’s something that they experience often. For me, information is more like a tool to convey something rather than an inquiry, a field of inquiry. It’s a by-product of the way I work.
How can we deal with our own information overload?
I: Project wise I make huge folders and everything is very messy, but contained. More on the personal level I really try not to collect any data that I produce. I have friends who are super into, you know, “Oh, you need to have this watch, cause then when we go running…” And I really try not to have any of that because I think that’s ridiculous. This data you’re producing is not really for yourself. It doesn’t tell you that much about yourself. You’re more feeding into these larger companies that you recalibrate. So I really try to detach myself from producing data for other people. I feel like you have power over knowing things that maybe a few years ago, we wouldn’t even be interested in. And that’s what scares me a little bit. Maybe I will be behind in a few years and I will need to catch up with it, but for now, I try to not be another producer of data.
